Learn / Guides / Customer experience guide
7 customer experience metrics and KPIs recommended by CX pros
Customer experience (CX) is the sum of every interaction a customer has with your brand, and is an important indicator of how likely they are to return or recommend you to others.
In this guide, you’ll learn how to measure and improve the top seven metrics and KPIs (key performance indicators) used by CX professionals to gauge how the customer experience improves—or worsens—over time, and evaluate the success or failure of product or business changes.
Last updated
11 Jul 2022
What are customer experience metrics?
Customer experience metrics measure how easy, enjoyable, and useful customers find their experience with your business across the entire customer journey.
Quantitative CX metrics like CSAT and CES (more on those later) let you track customer sentiment numerically so you can see at a glance where your customers are happy and identify areas for improvement where they’re not.
Qualitative customer data like survey feedback (e.g. responses from open-ended questions and behavior analytics insights like session recordings) provide a more detailed view of what’s happening behind the metrics and help explain why customers are satisfied or not.
Improve the customer experience metrics that matter
Hotjar Feedback and Surveys capture in-the-moment comments from customers, giving you the insights you need to improve CX.

Why tracking CX metrics is important
Measuring and optimizing for improved customer experience has two important positive impacts on any business:
Increased customer loyalty, leading to repeat business
Increased customer satisfaction, leading to positive reviews and word-of-mouth growth
Since the customer experience is broad and affected by many potential touchpoints, from navigating a website to chatting to customer support, CX metrics can also align teams across the company—which helps everyone develop empathy for their customers and focus on holistically improving their experience.
The top 7 customer experience metrics used by experts
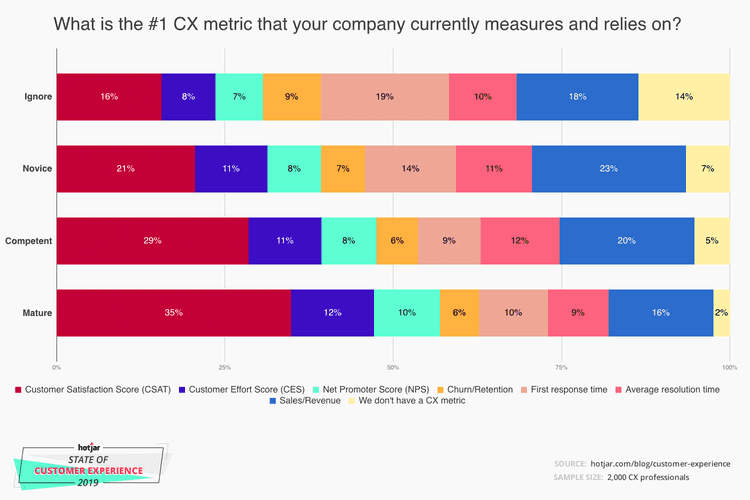
Based on our survey of 2000 CX professionals, the best customer experience metrics to track are:
Customer Satisfaction Score (CSAT)
Customer Effort Score (CES)
Net Promoter Score® (NPS)
Customer churn and retention
First Response Time (FRT)
Average Resolution Time (ART)
Customer Lifetime Value (LTV)
Keep reading to learn more about each CX metric: what it is, how to track it, and how to improve customer experience by using it.
1. Customer Satisfaction Score (CSAT)

Customer Satisfaction Score (CSAT) is a simple measure of user satisfaction with a product, website, or service. A standard CSAT survey asks: “How satisfied were you with [product/website] today?” on a scale of 1 to 5, where 1 is very unsatisfied and 5 is very satisfied.
Measure CSAT by asking customers how satisfied they are at a relevant part of the customer journey, for example on a purchase confirmation page or when a user is logging out. To calculate CSAT, add up the number of 4 and 5 ratings, divide by the number of responses, then multiply by 100.
If you’re using Hotjar Surveys: add a popover survey to any website page and use conditional logic to trigger CSAT follow-up questions if customers leave low ratings to find out why they aren’t satisfied.
You can also collect CSAT responses from customers at any point in the user journey with Hotjar’s Feedback widget (and, yes, you can—and should!—add follow-up questions here, too).

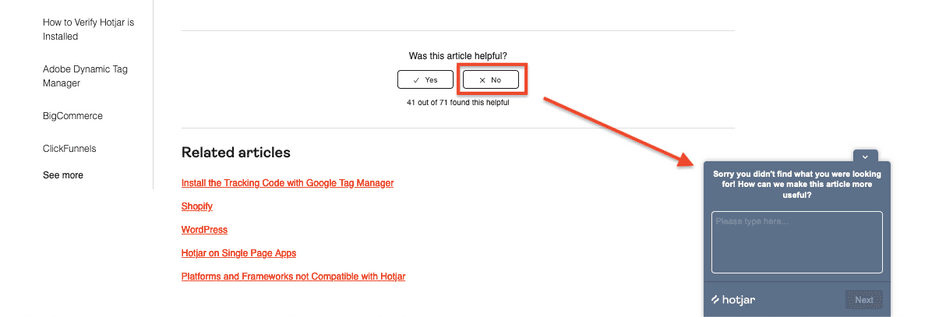
Using Hotjar’s Feedback tool to measure blog experience
2. Customer Effort Score (CES)
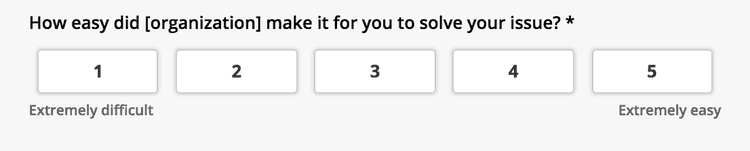
Customer Effort Score (CES) measures the amount of effort a customer has to exert to perform an action (e.g. purchase a product, find information, or resolve a problem). CES is usually rated on a scale of 1 to 5 or 7, from very difficult to very easy.
Measure CES by asking customers, “How easy was it for you to [insert action here]?” when they complete a key action, for example:
After making a purchase
After using a service
After talking to customer support

You want CES to be as high as possible—a low Customer Effort Score means customers either find your website difficult to use, or customer support unhelpful. Asking a follow-up question on low CES ratings will help you find out what’s holding customers back and adding friction to their journey.
If you’re using Hotjar: filter Recordings by rage clicks to find parts of your website or app where users click repeatedly in frustration. These customers might be making a lot of (unnecessary) effort to get something done.
3. Net Promoter Score® (NPS)

Net Promoter Score® (NPS) is a customer loyalty and satisfaction metric obtained by asking customers how likely they are to recommend your product or service to others on a scale of 0 to 10.
Collect NPS responses by asking the standard NPS question (“On a scale of 0–10, how likely are you to recommend us?”) after a customer has received delivery of a purchase or used a service for a reasonable amount of time (pro tip: don’t ask too soon, like we did!).

Calculate NPS by categorizing responses into detractors (0 to 6), passives (7 and 8), and promoters (9 and 10), and subtracting the percentage of detractors from the percentage of promoters.
You can use an NPS calculator to work out your score, or, if you’re using Hotjar Surveys, select the NPS option when creating a new survey and your score will display automatically, like this:

NPS is a useful (and popular) benchmark to help alert you to customer experience problems, but it won’t help you fix them without follow-up questions.
When we set up our own NPS survey, we used Survey Logic to trigger relevant follow-up questions to find out more:
We asked those who scored 9 and 10 (i.e. our promoters): “We’re thrilled you feel that way. What’s the main reason for your score?”
We asked those who scored us less than 7 (i.e. our detractors): “What can we do to improve Hotjar… and your score?”
We asked everyone: “If we could do anything, what could we do to WOW you?”
The responses to these follow-up questions helped us plan our roadmap and make improvements to our product.
Here are some more examples of NPS survey questions that combine the standard quantitative NPS metric with qualitative feedback.
If you’re using Hotjar: combine responses from Surveys with session replays from the Recordings tool to connect the dots between how individual customers rated you (i.e. their NPS survey responses) and what they experienced (the session replay) while visiting your site. Use this insight to fix the bugs that bugged your 'detractors', and you'll see your Net Promoter Score® improve.
4. Customer churn and retention
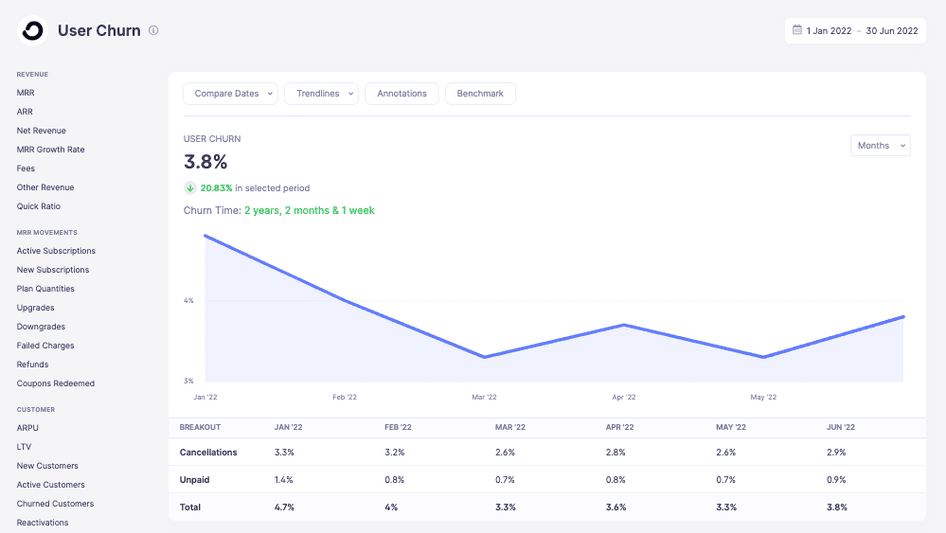
Customer churn at ConvertKit
Customer churn rate measures the percentage of customers who stop subscribing to or buying products from a company. On the flip side, customer retention is a business’s ability to keep its customers over time. The goal for every business type is to reduce churn and increase retention because it’s usually more costly to acquire new customers than to sell to old ones.
For SaaS and subscription businesses, monthly churn is calculated by dividing the number of customers who cancel in a month by the number of customers at the beginning of the month.
For ecommerce businesses, retention is tracked using cohort analysis to group customers who made repeat purchases in a chosen time frame.
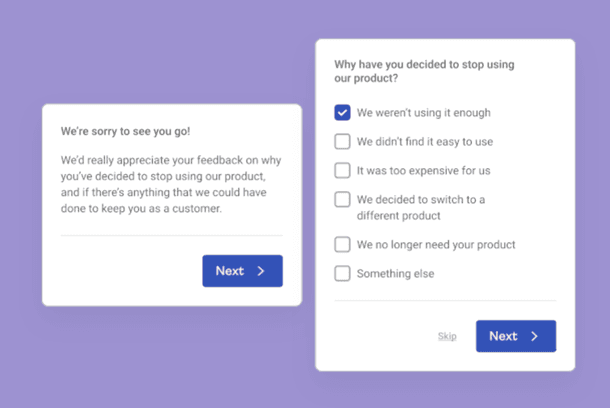
If you’re using Hotjar: high churn/low retention can indicate that something is wrong with the customer experience and is prompting customers to leave.
Set up a churn survey and collect insights that will reveal how to improve your product, if competitors are stealing your users, and whether your pricing is right.
5. First Response Time (FRT)
First Response Time (FRT) is a customer service metric that measures the average time it takes customer support teams to respond to a customer issue or request.
FRT can be measured in days or hours, and is calculated by adding up all first response times and dividing the result by the number of customer issues received.
[As a customer,] I am CONSTANTLY delighted when I’m not expecting a quick response but then get one.
The two ways companies can do this are:
Lowering customer expectations of response time. This is editable on Facebook Messenger/Intercom/Drift, etc.
Making sure you ALWAYS respond fast and hire an “around the clock” support team.
When done correctly, I feel special. I feel like the company truly values my time and attention and I am much less likely to churn and much more likely to rave about their support to my friends.
Hiring more customer support staff will likely shorten first response times, but another way to achieve the same outcome is to optimize your website or product to reduce the number of support requests you receive.
We did this in-house at Hotjar and doubled our self-service score (another CX metric that measures the ratio of customers who solve issues on their own compared to those who open support tickets) by:
Finding where users were getting stuck by analyzing session recordings, survey feedback, and support tickets
Improving support documentation so customers can solve common and simple issues on their own
6. Average Resolution Time (ART)
Average Resolution Time (ART) is the average time it takes a customer success team to successfully resolve each customer support request.
Like FRT, ART can be measured in days or hours. It's calculated by summing up the total duration of all customer conversations and dividing the result by the number of customer chats or tickets.
Generally, the quicker the ART, the more likely a customer is to be satisfied and have enjoyed a positive experience with your service or product.
7. Customer Lifetime Value (LTV)
Customer Lifetime Value (LTV) is the average revenue a customer is expected to bring to your company over time.
For SaaS companies, LTV is measured by dividing MRR (monthly recurring revenue) by the total number of customer accounts, then dividing the result by user churn rate.
For ecommerce, LTV is calculated by multiplying the average order value by purchase frequency and estimated customer lifespan.
LTV is a revenue metric, but we added it here because it’s popular with CX professionals as it represents customer loyalty and satisfaction: the happier your customers are, the more likely they are to buy from you again and stay subscribed, which increases their LTV and, ultimately, your business revenue. Win-win!
Start tracking better CX metrics
Now you know some of the top customer experience KPIs experts are using today, you need to pick the most relevant metrics for your business and get tracking.
The easiest way we know to get started is to sign up for Hotjar (welcome! 👋) and use one of our free survey templates to build a CSAT, CES, or NPS survey—or use Recordings to review customer sessions on your website or product and identify friction points.
Improve the customer experience metrics that matter
Hotjar Feedback and Surveys capture in-the-moment comments from customers, giving you the insights you need to improve CX.
Customer experience metric FAQs
Net Promoter, Net Promoter System, Net Promoter Score, NPS, and the NPS-related emoticons are registered trademarks of Bain & Company, Inc., Fred Reichheld, and Satmetrix Systems, Inc.